100+ Customer Experience Stats to Know in 2023

Last updated on June 27, 2023
Customer Experience
Customer experience (CX) plays a crucial role in business success, with 99% of CX leaders acknowledging its positive impact. However, only 3% of companies are truly customer-obsessed. Businesses that prioritize CX are more likely to be relevant, profitable, and successful.
Unhappy customers can have significant consequences, as they are more likely to switch to competitors and share their negative experiences. Consumer demand for better service continues to rise, and trust in brands is influenced by quality, personal experiences, and consistency.
Customer feedback analytics are essential for understanding and improving CX, yet many companies fail to regularly collect and analyze customer feedback. Metrics like Net Promoter Score (NPS) and Customer Effort Score (CES) are commonly used to measure CX.
Organizations with a customer-centric approach outperform their competitors, but there is a need for improved CX skills and cross-team collaboration. Customer service and support channels, such as email and phone calls, are critical for delivering a seamless experience.
In summary, customer experience and feedback analytics are vital for businesses to thrive and retain customers in today’s competitive landscape.
Find the latest stats on customer experience trends
- 99% of Customer Experience and Success leaders believe CEM has a positive impact on their business. (Lumoa, 2018)
- In 2019, customer experience will continue as a major factor in how companies do business. (Forrester, 2018)
- Over 80% of organizations expect to compete mainly based on CX, meaning that the skill of realizing benefits will be in high demand. (Gartner, 2018)
- According to customers, in 2022, only 3% of companies are customer-obsessed — putting customers at the center of their leadership, strategy, and operations — a decrease of 7 percentage points from the prior year. (Forrester, 2022)
- 80% of CEOs believe they deliver superior customer experience. Only 8% of their customers agreed. (Bain, 2005)
- 87% of marketers say they are delivering engaging customer experiences. (Acquia, 2019)
- 78.5% of CMOs agree or strongly agree that amazing customer experiences provide a powerful competitive advantage. (Martech Alliance, 2021)
- Nearly half (48%) of survey respondents said the customer experience they deliver falls below or significantly below their customers’ expectations. Just 31.5% believe they are exceeding expectations. (Martech Alliance, 2021)
- Customer-obsessed businesses expect to be 7x more relevant to customers, 5x more likely a top provider of products, and 4x more profitable. (Forrester, 2016)
- 55% of CX professionals believe their companies will be too slow and face disruption from more innovative, nimble, and customer-focused competitors. (Oracle, 2018)
- Optimizing customer experience is the most exciting opportunity for 19% of businesses, ahead of data-driven marketing that focuses on individuals (16%) and content marketing (14%). (Econsultancy, 2018)
- 91% of senior executives agree/strongly agree that the C-suite recognizes the importance of the digital experience for growth. (Adobe, 2022)
- 75% of marketing & CX practitioners have observed a surge in existing customers using digital channels (Adobe, 2022)
- 74% of CX professionals say creating a seamless customer journey across assisted and self-service channels is “important” or “very important.” (Gartner, 2021)
- 8 in 10 consumers report that businesses are meeting or exceeding their expectations for service, compared to 67 percent in 2014. In fact, 40% say businesses have increased their focus and attention on service, a significant increase in just three years (up from 29% in 2014). (AmericanExpress, 2017)
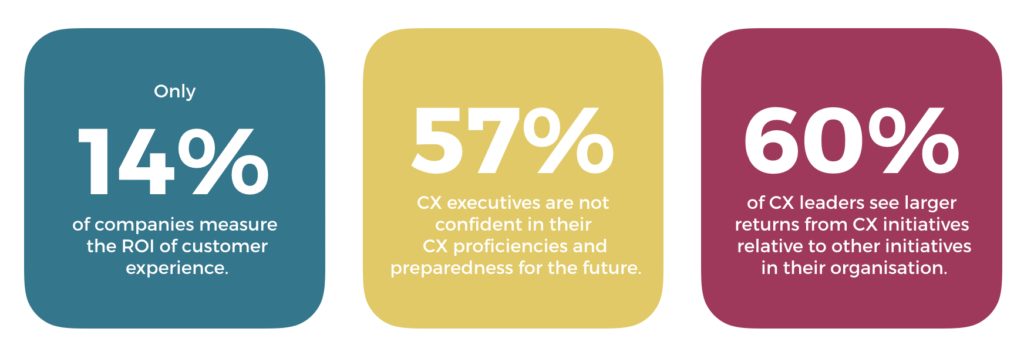
- Only 43% of CX executives are highly confident in their company’s CX proficiencies and preparedness for the future. (Oracle, 2018)
- 53% of organizations don’t believe they make it easy for customers to handle their issues/requests. (Gartner, 2022)
- 87% of organizations agree that traditional experiences no longer satisfy customers. (Accenture, 2018)
- By industry, supermarket chains provide the best customer experience, while TV and Internet service providers provide the worst. (Temkin, 2018)
- Just 34% of respondents report they have three or more years of experience developing end-to-end journey maps, and 83% report their organization struggles to use customer journey maps to identify and prioritize CX efforts. (Gartner, 2022)
- CX programs that exceed management expectations are 2.3 times more likely to have CX efforts in marketing not primarily focused on the path to purchase but on the journey after acquisition. (Gartner, 2022)
- Customer experience is a ‘significant’ or ‘critical’ priority for 69% of organizations. 77% have a centralized customer experience group, and 68% have a senior executive in charge of customer experience across products and channels. (Qualtrics, 2022)
Happy vs. Unhappy Customers
Learn how promoters differ from detractors
- 86% of consumers will pay more for a better customer experience. (Oracle, 2011)
- Businesses have a 60 to 70% chance of selling to an existing customer while the probability of selling to a new prospect is only 5% to 20%. (Marketing Metrics, 2010)
- Increasing customer retention rates by 5% increases profits anywhere from 25% to 95%. (Bain, 2014)
- 54% shared bad experiences with more than five people and 33% shared good experiences with more than five people. (Zendesk, 2013)
- 89% of consumers began doing business with a competitor following a poor customer experience. (Oracle, 2011)
- Customers who had a very good experience are 3.5x more likely to repurchase and 5x more likely to recommend the company to friends and relatives than if they had a very poor experience. (Temkin, 2018)
- After a bad experience, 22% cut their spending with the company and 19% stopped their relationships with the company completely. (Temkin, 2017)
- After a bad experience, 30% of consumers tell the company, 50% tell their friends, and 15% provide feedback online. (Temkin, 2017)
- 48% of consumers expect specialized treatment for being good customers. (Accenture, 2017)
Consumer demand better service from companies
- More than 60% of customers say they now have higher customer service standards. (Zendesk, 2022)
- 54% of customers who report positive emotions like feeling happy, valued, and appreciated are willing to forgive brands that make mistakes. (Forrester, 2022)
- In 2022, an average of 59% of customers trust the brands they interact with, 2 percentage points higher than the 57% of customers who trusted brands in 2020. (Forrester, 2022)
- Nearly half of consumers say brands don’t meet their expectations. (Acquia, 2019)
- 78% of people believe brands can do more to deliver happiness to their customers and 91% said they preferred brands to be funny; this number increased among Gen Z (94%) and Millennials (94%). (Oracle, 2022)
- The top three reasons a consumer would trust a brand are the quality of the product (66%), personal experience with the brand (53%), and consistency (32%). (Forbes Insights, 2020)
- Two-thirds of customers could not recall when a brand exceeded expectations. (Acquia, 2019)
- It’s a high-stakes game—61 percent of customers would now defect to a competitor after just one bad experience. Make it two negative experiences, and 76 percent of customers are out the door. (Zendesk, 2022)
- The large majority of consumers said they would switch to a competitor after three poor experiences or fewer. UK consumers are slightly more likely to leave a brand (90%) than their US counterparts (81%). (Emplifi, 2021)
Want more data?
We asked 100+ CX leaders about the future of customer experience.
Check the latest State of Customer Experience Report.
Customer Feedback and Surveys
Find all about customer surveying and feedback
- 39% of companies don’t regularly ask customers for feedback about their interactions — the most basic form of CX measurement. (Forrester, 2016)
- The average email survey response rate is 24%. (Fluid Survey, 2014)
- 75% of people complete surveys on their mobile. (IMImobile, 2018)
- 77% of companies say that they don’t model the drivers of CX quality regularly, leaving them in the dark about what matters most to their customers. (Forrester, 2016)
- 60% don’t regularly track operational data that reveals what really happened during interactions to help explain why customers felt the way that they did. (Forrester, 2016)
- 63% of CX professionals use customer feedback to prioritize investment in better products, services, and customer experiences. (Oracle, 2018)
- 79% of consumers who shared complaints about poor customer experience online had their complaints ignored. (Oracle, 2011)
- 79% of consumers who complained are still not happy with the way their complaints are handled. (CCMC, 2017)
Customer Experience Metrics and Data
Learn how to measure Customer Experience
- 21% of companies have developed their own KPIs to track customer experience. (Lumoa, 2018)
- Only 11% of companies have strong CX metrics programs and 62% of companies cite the lack of taking action based on CX metrics programs as the key problem. (Temkin, 2017)
- 78% of companies expect customer interaction history to become an increasingly important source of insights, and only 33% feel the same about multiple-choice survey questions. (Temkin, 2017)
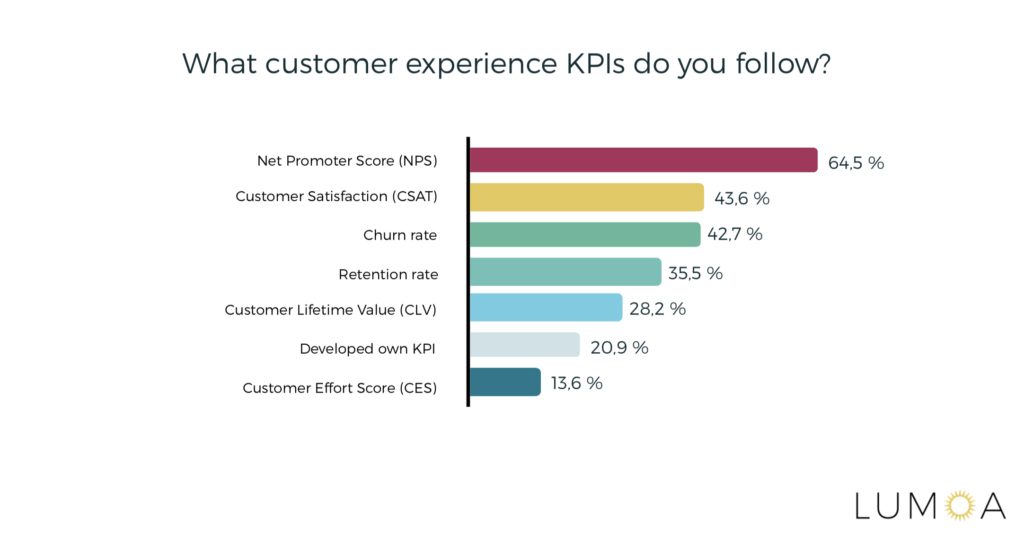
- 65% of companies measure NPS compared with 44% that measure CSAT and 14% that measure CES. (Lumoa, 2018)
- Only 32% of CX professionals feel they have access to the information they need to understand customers’ needs and previous interactions, and can apply it to improve their experience. (Oracle, 2018)
- Industry leaders reported that they improved their customer satisfaction KPI metric target by 47.1% over the last two years, 2.4 times higher than lagging organizations, which improved their customer satisfaction KPI metric target by 19.4%. (IDC, 2022)
Net Promoter Score
Utilize your NPS Better
- Net Promoter Score (NPS) is the most popular customer experience metric and is measured in two-thirds of companies. (Lumoa, 2018)
- In 2022, that is still true as 69% of CX Leaders are using NPS as a core CX metric. (Qualtrics, 2022)
- 32 is the Net Promoter Score of the Net Promoter System. (Lumoa, 2018)
- Compared with the detractors, promoters are 4.2x more likely to buy again, 5.6x more likely to forgive a company after a mistake, and 7.2x more likely to try a new offering. (Temkin, 2017)
- 83% of customers would trust recommendations from the people they know: colleagues, family, friends, etc. and 66% would trust other consumer opinions posted online. (Nielsen, 2015)
- An average NPS increase by 7 points correlates with a 1% growth in revenue. (London School of Economics, 2005)
Customer Effort Score
Is CES worth your attention? Short answer: YES!
- 96% of customers with a high-effort service interaction are more disloyal, compared to only 9% with low-effort interactions. (Gartner, 2018)
- 94% of customers going through an effortless experience are likely to repurchase vs. only 4% of those who went through a high level of effort. (Gartner, 2018)
- 81% of customers going through a high level of effort are likely to share their bad experience with friends vs. only 1% of those who went through an effortless experience. (Gartner, 2018)
- 17% of CX Leaders are using CES as a core CX metric. (Qualtrics, 2022)
Business Impact of CX
Find out how customer experience can influence your business KPIs
- Organizations that lead in CX outperformed laggards on the S&P 500 index by nearly 80%. (Watermark Consulting, 2018)
- Only 14% of companies measure the ROI of Customer Experience. (Lumoa, 2018)
- 61% of consumers would pay at least 5% more if they knew they would receive outstanding CX. (Emplifi, 2021)
- Experience-driven businesses grew revenue 1.4 times faster and increased customer lifetime value 1.6x more than other companies in the past year. (Forrester, 2018)
- Companies embracing service as a value creator achieve 3.5 times more revenue growth than those managing it as a cost center. (Accenture, 2021)
- Companies receive 10X+ higher revenue growth when they involve their service organization in the development of new products. (Accenture, 2021)
- 64% of business leaders say that customer service has a positive impact on their company’s growth. (Zendesk, 2022)
- Almost 20% of consumers say they usually (if not always) abandon a purchase because of a single poor customer experience. (Emplifi, 2021)
- Organizations with a cross-team approach with a customer at the heart of all initiatives are nearly twice as likely to exceed their business goal by a significant margin. (Econsultancy, 2018)
- 62% of CX leaders think that their organization needs to make major changes to the customer experience to meet their customer strategy. (PwC, 2017)
- 60% of CX leaders see larger returns from CX initiatives relative to other initiatives in their organization. (PwC, 2017)
Customer Centricity
Are you obsessed with your customers?
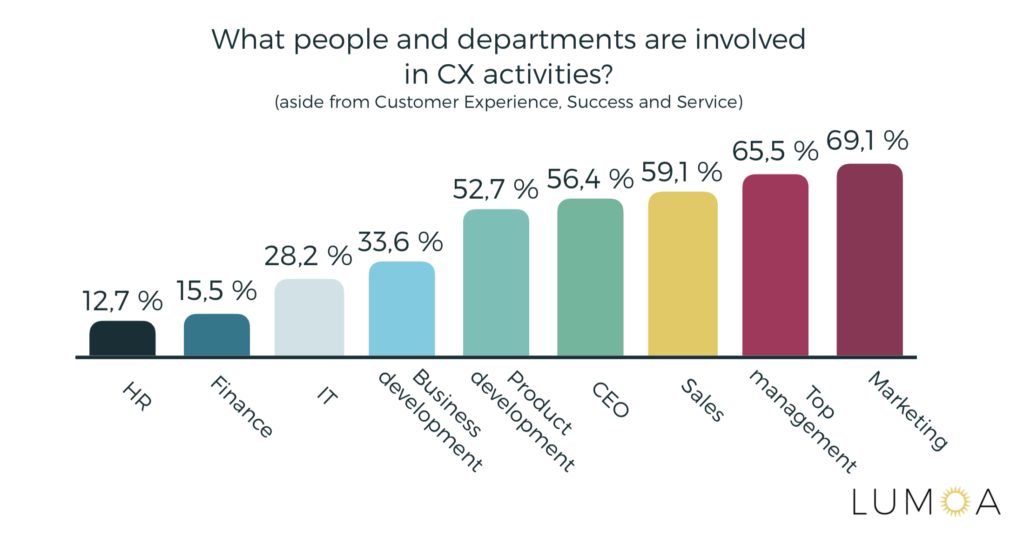
- 56% of CEOs and 66% of top managers are involved in Customer Experience activities according to the employees. (Lumoa, 2018)
- 26% of CX teams experience a lack of skills and are not sure how to deal with the new consumer mindset and constantly changing market. (Lumoa, 2018)
- Only 13% of companies believe that HR has an impact on Customer Experience activities in the company. (Lumoa, 2018)
- 90% of experience decision-makers agree that the CMO should be the internal advocate for their customers. (Accenture, 2018)
- Forty-five percent of businesses manage the customer experience through their customer care organization, while 30% have marketing manage customer experience. (Genesys, 2017)
- Only 19% of businesses report that they have a dedicated customer experience team to manage the experience. (Genesys, 2017)
- 55% of companies suffer from organizational silos, incl. slow internal processes, and unwillingness to change. (Lumoa, 2018)
- Getting buy-in from the executive team, knowing about available resources, and justifying the need for those resources are among the main challenges for the customer support teams. (Support Driven, 2018)
- 72% of companies don’t review customer experience metrics or share them with all employees regularly. (Forrester, 2016)
- 39% of companies don’t keep a documented list of customer experience projects that are currently underway. (Forrester, 2016)
- 79% of employees in CX leading companies are engaged, compared with 49% in the companies with CX below average. (Temkin, 2018)
Customer Service and Support
Customer experience can’t go without customer service.
Channels
- 54% of customers used email customer service channels making it the most commonly used digital customer service channel. (Forrester, 2018)
- 9 in 10 consumers want absolute omnichannel service – they expect a seamless experience when moving from one communication method to another, such as phone to text or chat to phone. (NICE inContact, 2018)
- 59% of customers had a conversation with a customer service representative or agent via telephone, making phone calls the most commonly used customer service channel. (Forrester, 2018)
- 87% of customers find it frustrating to repeat themselves in multiple channels, and 73% question doing business with that brand as a result. (Precisely, 2020)
- 93% of consumers will spend more with companies that offer their preferred option to reach customer service (ex: chat) (Zendesk, 2022)
- 89% of consumers will spend more with companies that allow them to find answers online without having to contact anyone. (Zendesk, 2022)
- More than 70% of customers expect agents to have access to all information relevant to their account and query. (Zendesk, 2022)
- 63% of customers are happy to be served by a chatbot if there is an option to escalate the conversation to a human. (Forrester, 2018)
- 90% of customers prefer to talk to a live service agent over a chatbot. (NICE inContact, 2018)
- Contact center performance drives both loyalty and churn. 90% of consumers said they are likely to stay loyal after a positive call center experience; 73.7% said they are likely to switch after a negative call center experience. (CallMiner, 2020)
- Approximately 50% of consumers will use mobile messaging apps for customer service and support. Another 28% are willing to give mobile messaging a chance. (Genesys, 2018)
- 68% of customers worry their query gets lost or misunderstood by fully automated services. (Forrester, 2018)
- 76% of customers want human contact to remain part of customer service. (Forrester, 2018)
Speed
- Slow response time (37%) was rated as the leading contributor to a negative experience, followed by a lack of 24/7 customer service support (23%). (Emplifi, 2021)
- 52% of consumers said a fast response within one hour is expected. 1 in 10 consumers wants a response in less than 5 minutes. (Emplifi, 2021)
- Earlier, 50% of consumers give a brand only one week to respond to a question before they stop doing business with them. (Oracle, 2010)
- 73% say that valuing their time is the most important thing a company can do to provide them with good online customer service. (Forrester, 2016)
- 77% of customers believe it takes too long to reach a live agent and consumers will wait on hold for an average of 11 minutes before hanging up. (RightNow, 2010)
- 69% attributed their good customer service experience to quick resolution of their problem. (Zendesk, 2013)
- 72% blamed their bad customer service interaction on having to explain their problem to multiple people. (Zendesk, 2013)
Relationships and Emotions
- 81% of consumers say that getting a satisfactory answer is a very important part of servicing satisfaction, and 74% want a knowledgeable professional. But nearly half also say that personalized service (47%) and appreciation for them as a customer (45%) are very important in providing excellent care. (AmericanExpress, 2017)
- Nine out of 10 consumers value when a business knows their account history and current activities with that company, and seven out of 10 value having the same representative or agent help them each time they interact with the company. (Genesys, 2017)
- 51% of consumers felt like they received nothing after a customer service interaction. (CCMC, 2017)
- 56% of customers with a problem experienced rage. (CCMC, 2017)
- Commonly used practices in customer service, that consumers hate: misuse of automated phone technology e.g. no live person option, outsourcing service abroad, upselling, having to repeat information already given and talking too fast. (CCMC, 2017)
Personalization
Learn how customers value the personalization of service
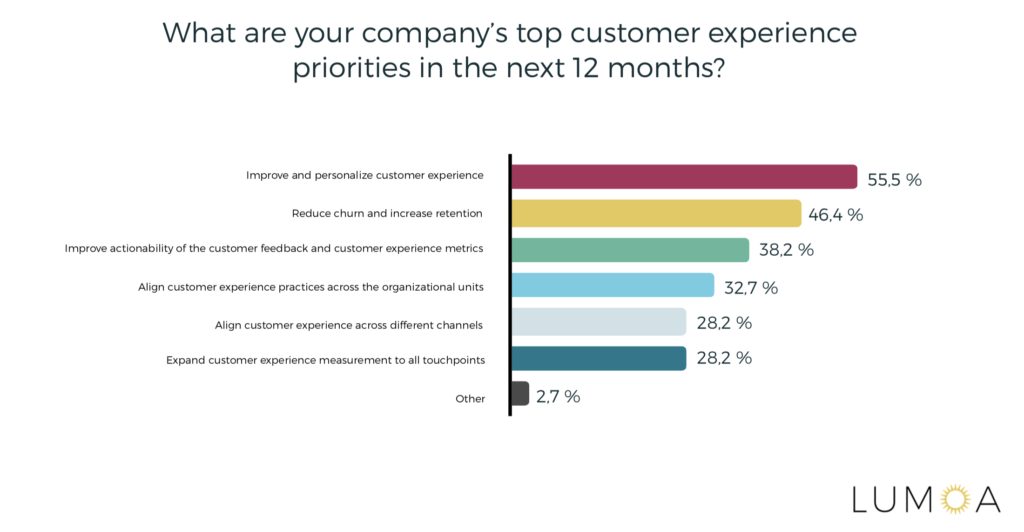
- 56% of customer experience professionals aim to improve and personalize the customer experience. (Lumoa, 2018)
- 83% of consumers are willing to share their data to enable a personalized experience. (Accenture, 2017)
- Personalization at scale can drive between 5 and 15% revenue growth for companies in the retail, travel, entertainment, telecom, and financial services sectors. (McKinsey, 2017)
- 33% of consumers who abandoned a business relationship in 2016 did so because personalization was lacking. (Accenture, 2017)
- 58% of consumers would switch half or more of their spending to a provider that excels at personalizing experiences without compromising trust. (Accenture, 2017)
- 64% of millennials value anticipation and customization of the experience using their transaction data over privacy concerns. 46% value personalization using preferences and contact info over privacy concerns. At the same time, 45% of baby boomers (age 55 and over) value privacy over personalization. (Genesys, 2018)
Customer Experience Technologies
Find out what technologies CX leaders use
- By 2021, 15% of all customer service interactions will be completely handled by AI, an increase of 400% from 2017. (Gartner, 2017)
- By 2019, over 85% of new packaged customer service and support software will be delivered on a cloud-based model. (Gartner, 2017)
- 48% of CX professionals said that although their companies embrace digital, they don’t think they’ll keep pace with the speed of technology change. (Oracle, 2018)
- 79% of contact center leaders plan to invest in greater AI capabilities in the next two years. (Deloitte, 2021)
- 80.1% of leaders fully automate their data validation, data access policies, and data set management processes, while only 3.2% of lagging organizations fully automate these processes. (IDC, 2021)
- 53% Of CMOs said a lack of skills/knowledge of the technology and/or data management was one of the biggest barriers to realizing their CX vision. (Martech Alliance, 2021)
- Nearly 70% agreed that customer experience would be drastically improved by introducing a customer data platform (or better managing an existing one). (Martech Alliance, 2021)
- 70.5% of CMOs say data compliance, privacy, and ethics are vital to achieving customer experience success. (Martech Alliance, 2021)
- More than 24% of companies report experiencing a lack of customer insights in marketing/customer experience organizations. (Adobe, 2022)
- Technology spend is expected to have substantial expected growth throughout 2022, with notably less spend expected for both facilities and T&E. (Gartner, 2022)
- Over 50% of CX professionals say their organization is planning to use predictive analytics and artificial intelligence ‘somewhat’ or ‘significantly’ more than they were doing so last year. 44% of respondents’ organizations plan to use journey analytics more, as well. (Qualtrics, 2022)
- 31% of organizations have already invested in technology like AI to outpace the competition. (Accenture, 2018)
- 76% of collaboration leaders are investing or expanding their emerging technology investment. (Accenture, 2018)
- 26% of companies leading financially use CX technologies, compared to 7% of laggards. (Bain, 2018)
- Predictive analytics and Artificial Intelligence are in the most demand among CX professionals. (Bain, 2018)