How to Analyze Survey Results: A Guide to Mastering Customer Feedback Analysis

Last updated on March 7, 2024
Analyzing survey results is more than just crunching numbers – it’s also about unlocking stories, understanding needs, and adapting to changes. These in turn, can shape Customer Experiences.
Welcome to a guide that’s all about making sense of those stories hidden within your survey data. Whether you’re a seasoned CX professional or just dipping your toes into the waters of customer feedback, this article is your friendly companion in turning those responses into actionable insights.
We’ll walk through the essentials and gradually go a bit more detailed in survey analysis, ensuring you’re well-equipped to elevate your customer satisfaction, boost sales, and fortify brand loyalty. From uncovering the basics to tackling common challenges, we’re here to help you navigate through the fascinating journey of customer feedback analysis.
In This Article:
Why Voice of Customer (VoC) Matters
To kick things off, we should first understand why Voice of Customer matters and how it affects your business. Customers are an integral part of any business’s success. Obviously, businesses wouldn’t exist without them! So it’s important to listen closely and understand what customers want from brands – that’s where the voice of the customer comes in.
Whether it be through surveys, focus groups, or even social media, businesses have access to valuable feedback on their products and services. This feedback helps inform how they operate going forward. And remember, feedback isn’t just about addressing criticisms—it’s also about recognizing and building on what you’re already doing well.
In one Gartner research, leveraging the data obtained from direct customer feedback can increase the chances of upselling and cross-selling by 15-20%. This shows the tangible, bottom-line benefits of listening to your customers.
Additionally, a well-executed VoC initiative also helps enhance customer retention, resulting in higher customer loyalty scores, reduced customer turnover, and increased customer lifetime value through repeat purchases. A ripple effect will occur – those businesses able to stay in tune with customer desires will have an advantage over their competitors. After all, if you know what your audience wants before they do – you’ll be miles ahead!
Why Analyzing Survey Results is Essential: Addressing Common Business Challenges
Imagine you’re running a bustling café in a busy city center. You pride yourself on the quality of your coffee and the ambiance of your space. To understand your customers better, you conduct a survey asking for feedback on everything from the coffee to the service. But what happens next is crucial. If you merely collect these responses without thorough analysis, you might miss key insights that could drive your business forward.
For instance, let’s say many customers subtly mention that they love the coffee but find the seating uncomfortable. Without proper analysis, you might overlook this feedback, focusing only on the positive comments about your coffee. This oversight could lead to a decrease in repeat visits, as customers choose other cafes with more comfortable seating.
This scenario highlights a common pain point for businesses: the gap between collecting customer feedback and effectively analyzing it to uncover actionable insights. Just as a chef needs to skillfully combine ingredients to create a gourmet meal, businesses need to adeptly analyze survey results to transform raw data into strategies that enhance customer satisfaction and drive growth.
When you know how to properly analyze survey results, you’re uncovering the story behind your customers’ experiences. It is this insight that enables you to make informed decisions, such as rearranging your café’s seating arrangement or tailoring your services to better suit your customers’ needs.
Categories of Questions to Ask in Your Survey
Okay, so now you understand the importance of not just collecting but also effectively analyzing your survey results. But where does this process start? It all begins with asking the right questions. Let’s shift our focus to the heart of any survey: the questions themselves. When creating surveys, asking the right questions is the key to unlocking meaningful insights from your customer feedback.
By asking relevant and targeted questions, you can create a comprehensive picture of customer sentiment and gain valuable insights into what customers want from your brand. Let’s check out the types of questions that can supercharge your VoC surveys.
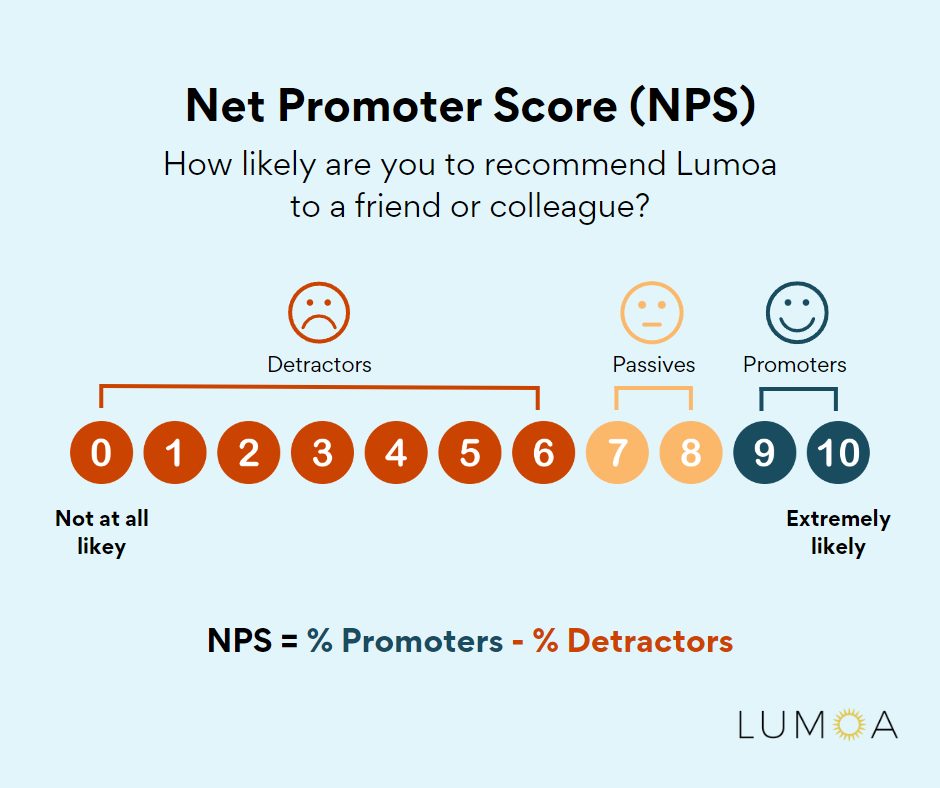
Net Promoter Score (NPS) question: This is a popular metric used to measure customer loyalty and satisfaction. This particular question seeks to gauge how likely a customer would be to recommend a company’s products or services to their friends, family, or colleagues. Customers are asked to rate the company on a scale from 0-10, with higher scores indicating higher customer satisfaction.
A high NPS score is a strong indicator of customer loyalty, which can drive repeat business and positive word-of-mouth referrals, thereby contributing to your company’s growth and reputation.
Customer Satisfaction questions: are designed to assess a customer’s overall satisfaction with the product or service they received, as well as their entire customer experience. How customers rate these questions can provide insights into how effective a business is, at meeting the needs and expectations of its customers.
In a nutshell, high CSAT scores often correlate with customer retention and loyalty, directly impacting your bottom line.

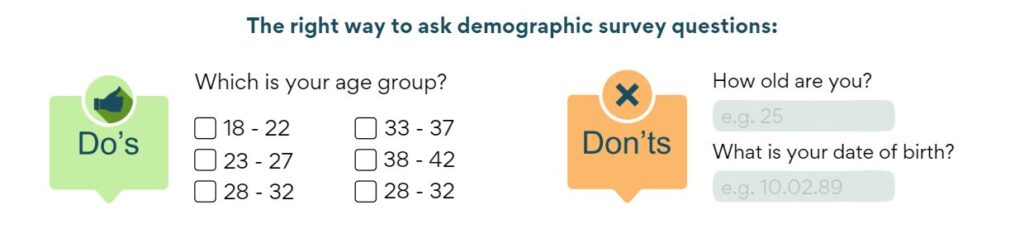
Demographic questions: These questions gather information about the respondent’s age, gender, income, education level, and other demographic information that can be used to segment and analyze the data. Knowing the demographic makeup of customers can help identify trends and correlations between certain demographics and customer satisfaction.
When conducting a survey, it’s essential to avoid any questions that could be seen as discriminatory. We should also make sure the collected data is relevant and our respondents understand how their information will be used; all while adhering to legal/ethical guidelines around demographic info collection!
It can be tempting to ask a ludicrous amount of demographic questions, to truly understand your customer and where they are coming from. Unfortunately, these can be tiring to fill out from a user’s perspective.
Remember that each additional question you have in your survey will decrease the amount of responses you get, sometimes only by a little bit, but they add up! Try to ask questions for things that you aren’t already tracking in your CRM or other business tool so that the information is important and the survey is kept light.
Behavioral questions will give you the bigger picture and help you assess how customers interact with a given product. This includes how often they use it, how much they spend, and how long they have been a customer.
What’s more, behavioral type of questions can help you customize your products and services accordingly.
Examples of some behavioral questions:
- How do you go to your workplace?
- How often do you buy travel tickets?
- Do you pay by card or cash?
Open-ended questions on the other hand, help you understand customer sentiment. It provides insights into customers’ thoughts and feelings that would otherwise remain hidden.
With these questions, customers can express their opinions and frustrations in more detail than with a structured question. The most exciting part? It may reveal underlying customer sentiments, helping you identify potential areas for improvement and innovate your offerings based on real customer feedback.
Examples of some open-ended questions:
- What were the main reasons you chose our product?
- How would you describe your experience with us?
- How can we make our product better for you?

Common Ways to Analyze Survey Data
Now that we’re all on the same page in the kind of questions to ask, let’s discuss the ways to analyze it. Analyzing survey data can be an overwhelming task, but with the right approach, it’s possible to extract meaningful insights from customer feedback and develop actionable strategies for improvement.
One such tool that can help is Lumoa, the first CX platform to offer GPT. thanks to its propriety AI, employees can now tap into any customer feedback, get clear answers, and take actions with a positive influence on KPIs.
In this section, we’ll explore some of the most common techniques used to analyze survey results, all of which can be easily performed using Lumoa. We’ll also provide screenshots from the Lumoa platform to give you a visual understanding of how these techniques work in practice.
From basic analysis methods to more advanced techniques, you’ll gain a better understanding of how to unlock the potential of your customer feedback.
-
Frequency analysis: This involves counting the number of times a particular response is given to a question. It helps to identify patterns and trends in the data, such as which options are most popular or least popular.
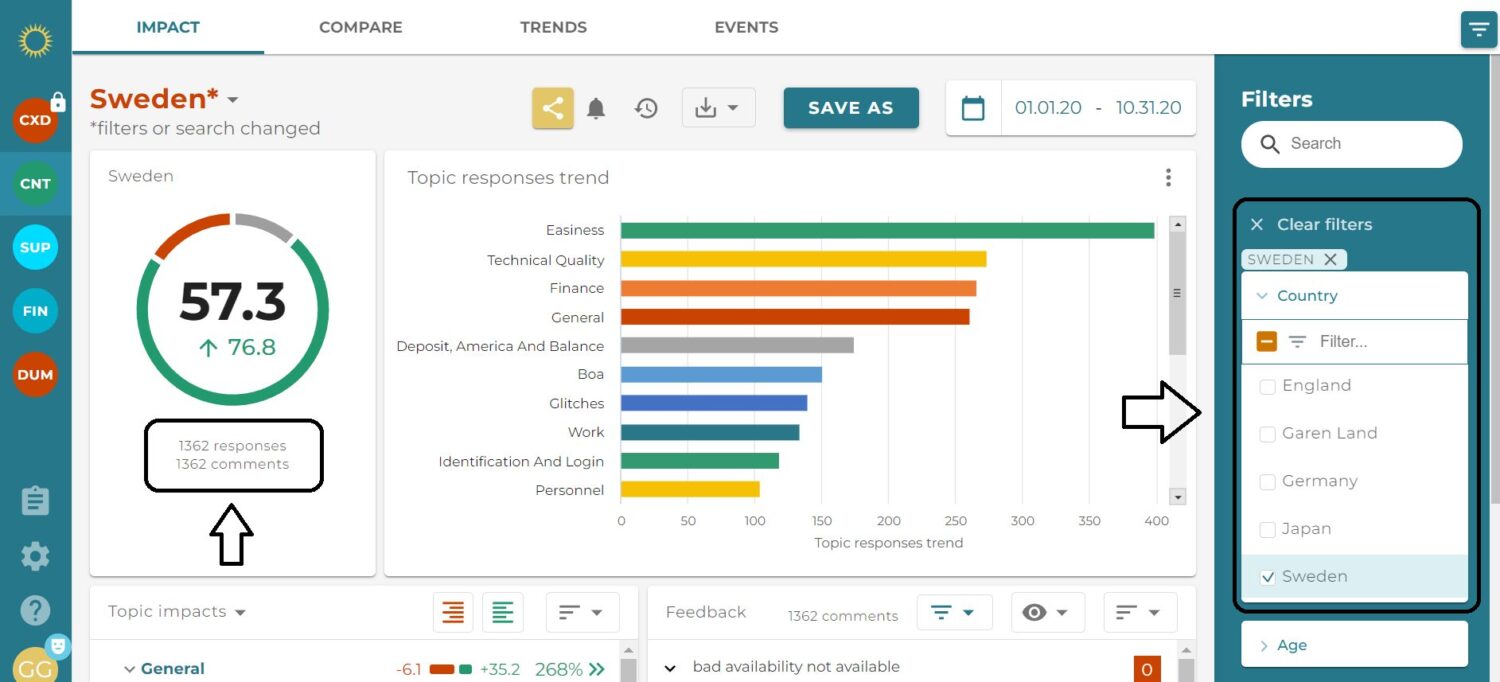 In the visual above, we see the frequency of responses to a question like “What region are you from?” This illustrates how frequency analysis can provide a clear snapshot of the distribution of responses, revealing patterns and trends.
For instance, you can easily identify the most and least represented regions among your respondents. This logic can be replicated for each question in your survey, helping you understand the most and least common responses.
Understanding these patterns can help you prioritize improvements and capitalize on what’s working well.
-
Sentiment analysis: This is a method of using natural language processing and text analysis techniques to determine the emotional tone behind a customer’s response. It can be useful for identifying positive, negative, and neutral sentiments in open-ended survey responses.
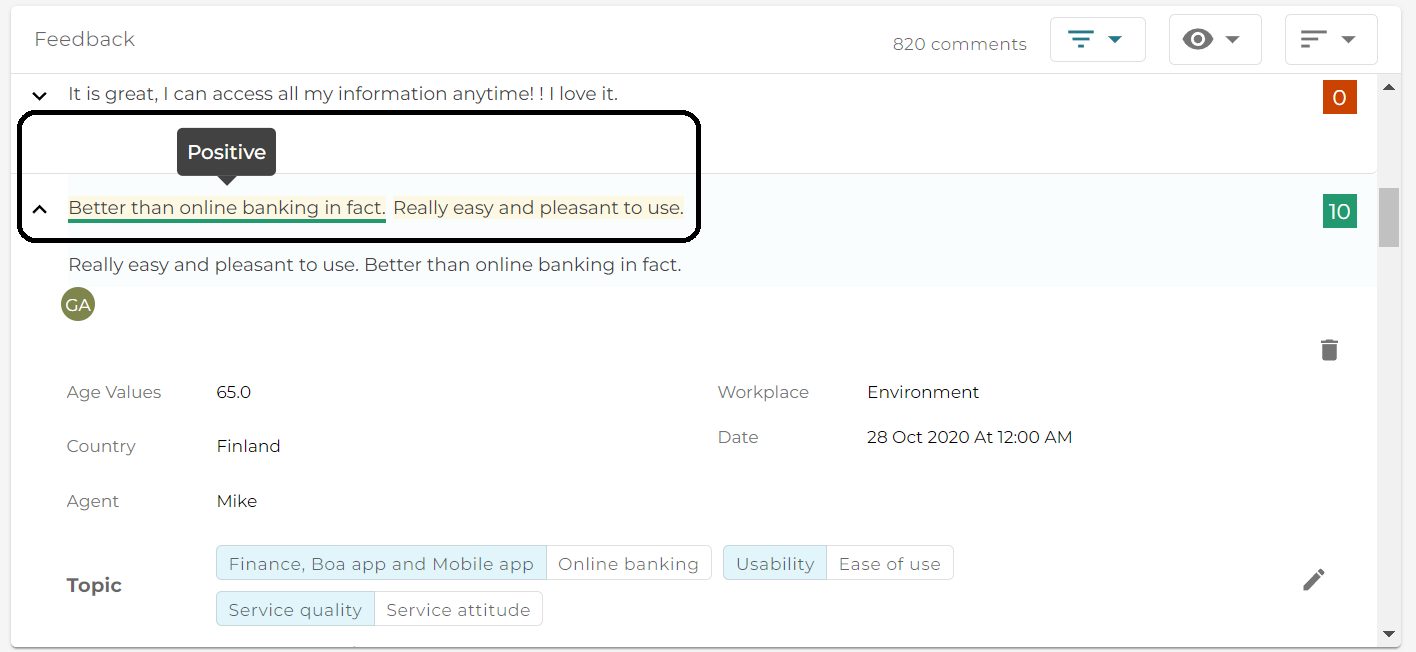 In the visual above, we see Lumoa’s AI in action, determining whether parts of a comment are positive, negative, or neutral. In this example, the AI has identified a portion of the comment as “positive.”
With this information, you can address specific areas of concern and build on what’s working well to enhance customer satisfaction.
-
Regression analysis: This method is used to identify relationships between different variables in the data and can help to identify patterns and trends over time.
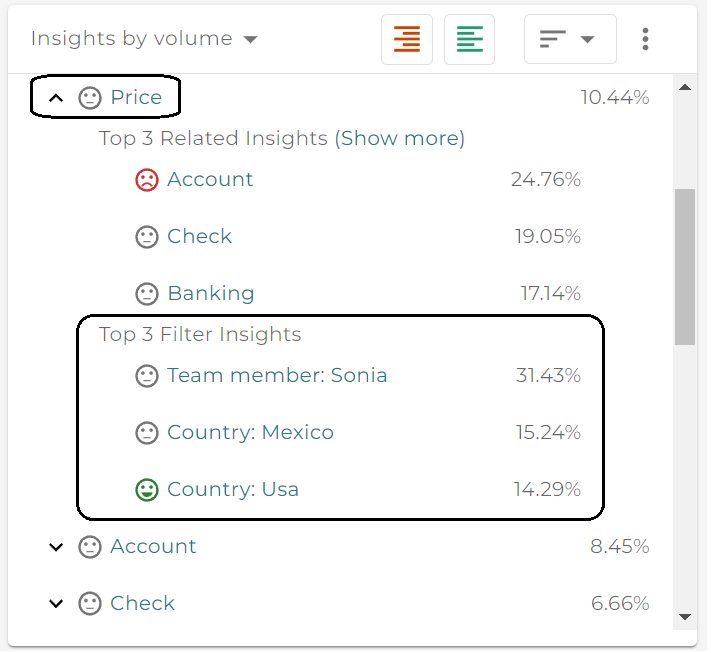
Here, we see an example of Lumoa’s AI performing regression analysis. In this case, the AI is determining that when people use the word “Price” in their open text response, they often do so when they are from regions like “Mexico” or when speaking to certain team members through support.This information will help you identify specific factors that influence customer feedback, enabling you to tailor your strategies and responses accordingly. For instance, you might decide to provide additional training for certain team members or review your pricing strategy for specific regions.
-
Cluster analysis: This method groups similar responses together, which is useful for identifying patterns or segments within the data.
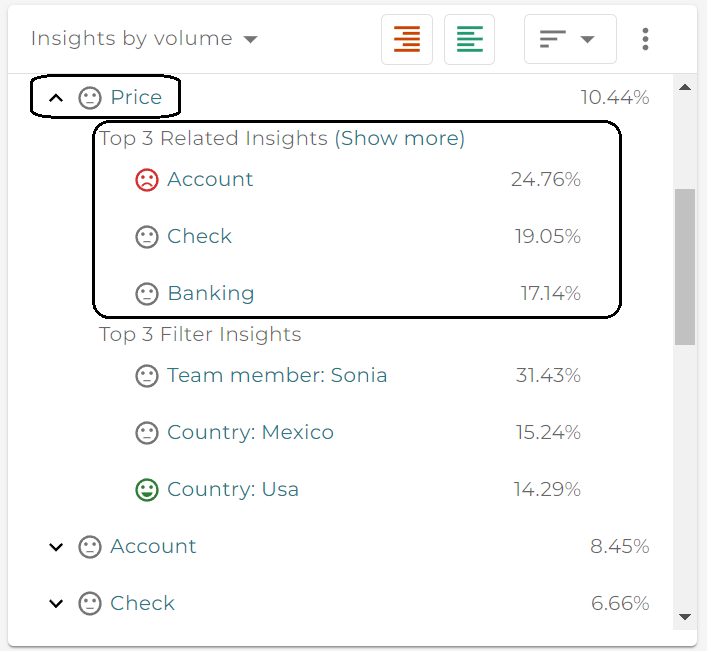
In this case, Lumoa’s AI is showing us that when people mention “price” in their open text response, they often use the words “account” and “banking” in the same comment.
The smileys represent the sentiment when those words are used. This insight identifies common themes or issues in customer feedback, enabling you to address specific areas of concern.
For instance, if customers often mention “price,” “account,” and “banking” together in a negative context, you might decide to review your pricing strategy or improve your account management and banking services.
-
Text mining: This method extracts useful information from unstructured text data, such as open-ended survey responses. It’s used to identify common themes or keywords in the data.
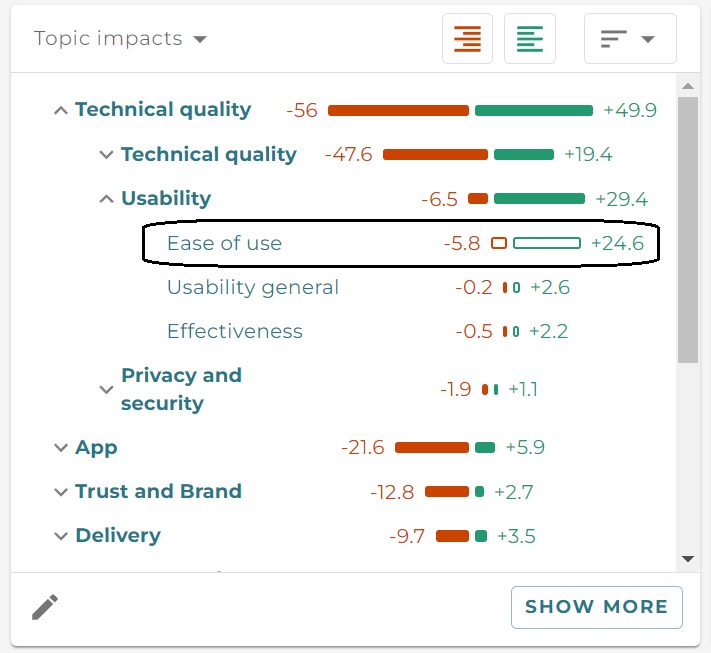 In the visual above, we see an example of Lumoa’s AI performing text mining. In this case, Lumoa has created overall groupings of themes found in open-text responses. These groupings, called “Topics”, can be managed and edited by your organization.
This is beneficial in identifying common themes or issues in customer feedback, enabling you to address specific areas of concern.
For instance, if a particular topic frequently appears in negative feedback, you might decide to focus your improvement efforts on that area.
-
Data visualization: This method displays data in a graphical format, such as charts, tables, and graphs. It can be used to make the data more understandable and to identify patterns and trends that may not be immediately apparent in the raw data.
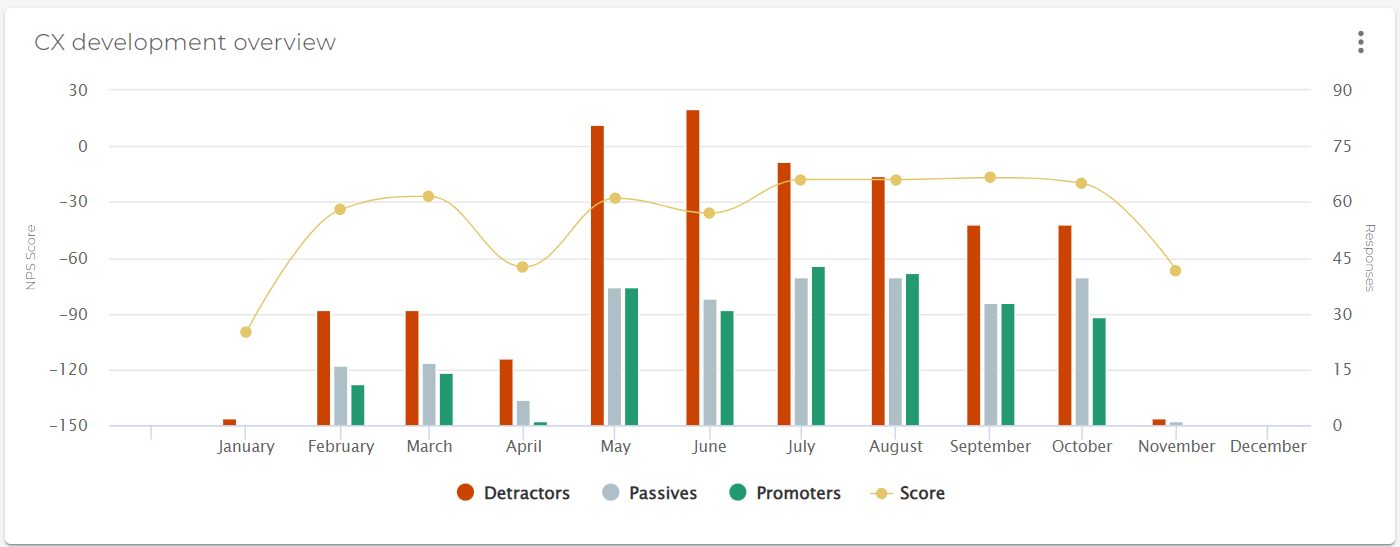 In the visual above, we see one example of how Lumoa can help you make sense of your data.
Lumoa offers a variety of graphs and charts for different purposes, such as determining trends and recurring issues, as well as tracking issues over time.
By presenting data in a visual format, you can gain a clearer understanding of your customer feedback, making it easier to identify areas for improvement and monitor the impact of your actions over time.
Best Practices for Interpreting and Utilizing Survey Insights
Having the right approach to analyzing survey data is essential for unlocking its potential, but it’s also important to know how to interpret and utilize the insights you uncover. Check out some best practices for interpreting and utilizing survey insights.
From understanding customer sentiment to developing actionable strategies, we’ll go over all the key steps involved in creating a successful VoC program.
-
Clearly define your research objectives: Before beginning the survey, be sure to establish clear research objectives that will guide the design and analysis of the survey.
-
Use a representative sample: Make sure that the sample of participants is representative of the population being studied in order to ensure the validity of the survey insights.
-
Use open-ended questions: Open-ended questions allow customers to provide detailed feedback in their own words, which can provide valuable insights into their thoughts and feelings.
-
Use data visualization: Use data visualization techniques such as charts, tables, and graphs to display the data in a way that is easy to understand and identify patterns and trends.
-
Use statistical analysis: Use statistical analysis techniques such as frequency analysis, cross-tabulation, and regression analysis to identify patterns and trends in the data.
-
Use text mining: Use text mining techniques to extract useful information from unstructured text data, such as open-ended survey responses.
-
Look for patterns and trends: Look for patterns and trends in the data that can help identify areas for improvement or opportunities for growth.
-
Identify key drivers: Identify key drivers of customer satisfaction, loyalty, and behavior that can be used to improve the customer experience.
-
Prioritize your findings: Prioritize your findings based on their importance and potential impact on the business.
-
Act on your findings: Use the insights gained from the survey to make data-driven decisions that will improve the customer experience and achieve organizational goals.
To illustrate the practical applications of analyzing survey results and implementing changes based on VoC insights, let’s look at a real-life example.
Huel, a popular meal replacement company, recognized the need to better understand their customers’ experiences and improve their Net Promoter Score (NPS). Before, they tracked NPS without taking any significant action. However, as the company decided to make NPS a key business KPI, they needed a scalable and efficient way to analyze and act upon customer feedback.
This led Huel to adopt Lumoa, a platform that enabled them to analyze NPS data, answer customer questions, and create targeted strategies. Lumoa’s intuitive interface and text analytics allowed everyone in the company to better understand customer sentiment, making NPS a more accessible and successful KPI.

One of Lumoa’s most impactful features for Huel was the ability to segment NPS data by different customer segments. This allowed them to track customer lifecycles and understand how perceptions and pain points evolved over time. As a result of implementing Lumoa, Huel saw their NPS score increase by 10 points and their global response rate increase by 164%, which significantly improved their customer experience and decision-making capabilities.
This example illustrates the power of effective survey analysis and the impact it can have on a company’s success.
Creating an Action Plan
Creating an action plan based on survey results is an effective way to turn customer feedback into meaningful insights. This will drive your business forward. It can help you identify key drivers of customer satisfaction, loyalty, and behavior so that you can make informed decisions and create strategies that improve the customer experience and achieve organizational goals.
-
Identify Key Insights: Start by reviewing your survey results and identifying the most important insights. Look for patterns, trends, and key drivers that stand out. You can find out where customers are most satisfied or dissatisfied, what common themes are in open-ended answers, and what correlations there are between them.
-
Prioritize Based on Impact: Not all insights will have the same potential impact on your business. Rank your findings by their potential to drive customer satisfaction, loyalty, and business growth. Consider the number of customers affected, the severity of the problem, and the potential for improvement.
-
Set Clear Objectives: For each priority insight, set clear objectives. These should be specific, measurable, achievable, relevant, and time-bound (SMART). For example, if customer service is a common complaint, you could aim for a 25% reduction in wait times within six months.
-
Develop Strategies: Next, develop strategies to achieve your objectives. It may involve improving processes, investing in new tools or training, or making changes to your products or services. Consider investing in more customer service staff, implementing a new platform, or improving self-service options to reduce wait times.
-
Assign Responsibilities: Assign responsibility for each strategy to a specific person or team. In this way, accountability is ensured and a clear point of contact is provided.
-
Create a Timeline: Develop a timeline for implementing your strategies. To keep everyone on track, you should set key milestones and deadlines.
-
Monitor Progress: Regularly monitor your progress toward your objectives. Tracking metrics, doing follow-up surveys, and getting feedback from customers and staff could be part of this process. Be prepared to reassess your strategies and make changes if you’re not making the progress you expected.
-
Communicate Your Plan: Finally, communicate your action plan to all relevant stakeholders. This includes not only your staff but also your customers. You can build trust and improve customer satisfaction by letting them know you’re taking their feedback on board.
Wrapping up
Customer-centric businesses need to understand their customers’ needs, preferences, and pain points. Surveys are great tools for collecting this information, but their real value comes from analyzing and acting on it.
Throughout this comprehensive guide, we’ve explored why Voice of Customer (VoC) matters, the importance of analyzing survey results, the types of questions to ask in your survey, and the common ways to analyze survey data. We’ve also covered how to interpret and use survey insights, as well as how to create an action plan.
Remember, the goal is not just to collect data, but to transform it into actionable insights that drive your business forward. Getting the right approach to your survey data can boost customer satisfaction, sales, and loyalty.
Now, armed with this knowledge, you’re ready to take your survey analysis to the next level. No matter where you’re at with customer feedback, these strategies and techniques can help you get more value out of it.
So, don’t wait! You’ll see the impact it can have on your business when you apply what you’ve learned today. Remember, every piece of customer feedback is an opportunity for growth and improvement. Take it on, act on it, and watch your business grow. If you need more ways to boost your CX strategies, how about you check out the State of Customer Experience 2023? Download your copy now!