How To Calculate Survey Sample Size: A Simple Guide

Last updated on February 4, 2023
In this article, you will learn how to calculate survey sample size to ensure statistically significant results.
It seems in any given group of friends there are a number of casual experts. Maybe one is really into movies or music. Or, perhaps, there’s a “foodie” in the group. Since we don’t have direct access to lots of experts, those people in our lives tend to be who we consult if we’re curious about that topic.
However, what would happen if you found out your movie expert friend had only ever seen Twilight movies?
Their credibility with you would probably fade. It’s nothing against vampires or teen romance. It’s simply that movies are a complex art form and in order to have a sophisticated understanding, you probably need to see lots of movies. Five (yes, there were five Twilight movies) is simply not a large enough sample size.
In This Article:
What is a sample size?
Companies can ensure that their customer feedback is a reliable source of information for making decisions by accurately estimating the characteristics of their larger population. Sample size calculation accomplishes this, taking into account factors like variability and confidence level to make sure surveys are representative and results are significant. Doing so empowers businesses to better understand opinions and needs – allowing them to provide even more satisfying experiences!
The sample size is a term commonly used in market research that refers to the number of respondents to a survey. It’s referred to as a “sample” because it’s a small group that’s meant to represent a larger population or target audience.
For example, you may be interested to know how Americans feel about a certain topic. Since it’s not possible to survey the entire population, you gather a small group, or sample, of the population that’s representative of the whole and survey them to get an understanding of general sentiment.
How to determine sample size
There are a number of different things you may consider when you’re trying to determine how large a sample size you need in order to get reliable data. If your sample size is too small, the data may not be relevant and possibly misleading.
On the other end of the spectrum, if you try for too large a sample size your study could get very expensive and needlessly complicated. With that in mind, it’s paramount to your success that you’re able to properly determine the correct sample size for a given project. In order to do that, there are four areas to consider.
Determine sample size variables
- Population size – This number refers to the total number of people in your target audience. For example, you might be interested in SUV owners. For population size, it’s best to be as detailed as possible. For example, you might only look at people who currently own SUVs. Or, perhaps you want input from anyone who has ever owned an SUV. In either case, clearly defining those parameters is the only way to accurately understand your population size.
- The margin of error (confidence interval) – This number refers to how closely your sample size accurately represents your target audience. Having a smaller margin of error means a higher level of accuracy. Conversely, a larger margin of error means being less accurate. There will always be some margin of error, but you can control how big, or small, your sample size is.
- Confidence level – Related to the margin of error, confidence level refers to how accurate you feel your results are. Your confidence level, which is expressed as a percentage, states how sure you are that the mean falls somewhere within the margin of error. Generally speaking, most use a confidence level of 90%, 95%, or 99%.
- Standard deviation – This number refers to how many individual responses will vary between each other, and the mean. If there’s a low standard deviation, it means scores will all be clustered near the mean, so not much variation. A larger standard deviation means when plotted on a graph, responses will be more spread out. Standard deviation is expressed as a decimal, with 0.5 being a good standard deviation to set to ensure a proper sample size.
Calculate sample size
After you know the answers to the four above variables, you should be able to calculate your needed sample size.
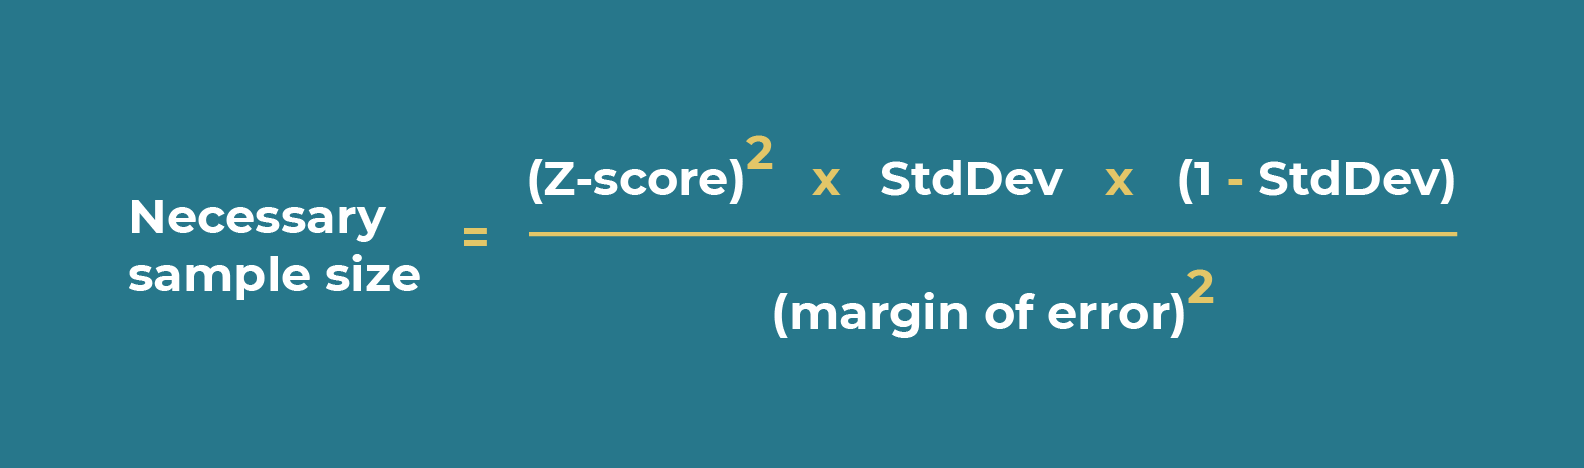
However, if you don’t know your population size you can still figure out your sample size. You’ll need two more pieces of information: a z score, and the sample size formula.
- Determine Z score – Your z score is simply the numerical representation of your desired confidence level. As mentioned above, 90%, 95%, and 99% are the most common percentages.
Below are the Z scores for those percentages:
90% = 1.645
95% = 1.96
99% = 2.576
If you’re interested in using a different confidence level than the above three, you can use this Z score table. - Use sample size formula – Once you have your Z score, you have all the data needed to fill out the sample size formula which is:
Example of calculating sample size
So, let’s say you’re interested in a confidence level of 90%, decide to use the recommended standard deviation of 0.5 and are comfortable with a margin of error of +/- 5%.
This is what your initial equation would be:
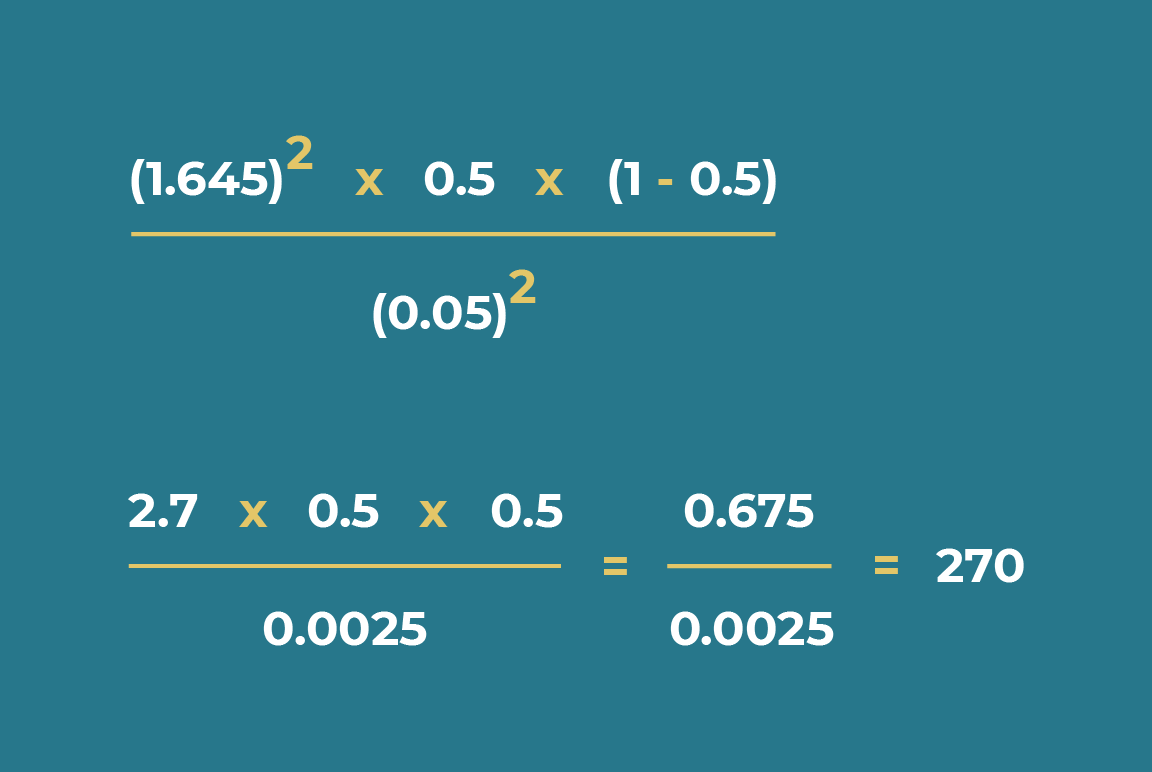
Which equals 270 and is your needed sample size to satisfy the conditions mentioned above. If you want to use a smaller sample size, you can lower your confidence level, or increase the margin of error you’re willing to accept.
That said, both of those adjustments could negatively impact the accuracy of your results. So, depending on what your study is for, it may not be the most advisable strategy.
Understand your dimensions
If you’ve calculated your sample size to be 350, but then want to further analyze the data by looking into specific parts of the data – you have to remember that the sample size is not enough to give you accurate results.
It’s only accurate when considering all the responses together.
For example, let’s say you calculate your sample size should be 400 to give you accurate results. When looking at all 400 responses together, you have an accurate representation of the target audience.
However, let’s say you break the results down by country. You collected 200 answers from the US and 200 from the UK. These sample sizes are not enough to give you an accurate view of the results in each country. You can make statements about the entire response pool, but you could not calculate a specific result from one of these countries.
With that being the case, you should determine upfront what dimensions you’re interested in for your study.
1. What are the dimensions you want to see your data from?
Realistically, there is any number of ways you could segment your data and endless dimensions you may be interested in. That said, there are a few that are more common you should consider prior to running any study.
For example, you might be interested in a dimension around demographic information such as location, age, or gender. If you run an e-commerce site you may also be interested in segmenting data based on different customer attributes like if they’re a first-time buyer, the size of their purchase, or their CSAT score.
2. How often do you want to have reliable results?
The cadence –regular interval of time between surveys– of your surveys is also an important factor to consider. If you want to look at your data to see if there are any changes from one month to another, you need to have a regular cadence for running surveys.
For example, let’s say you’ve calculated that your sample size should be 400. This means that you have to receive 400 responses monthly to be able to compare results month by month. If there’s a fluctuation between months, you won’t be able to reliably compare the results.
General rules for sample size
As we’ve mentioned throughout this post, there are lots of variables to consider when generating your specific sample size. That said, there are still a few general rules to know when creating a sample size to get the best results possible.
Rule 1: Balance cost and confidence level
In order to increase your confidence level, or reduce your margin of error, you have to increase the sample size. Larger sample sizes almost always mean higher costs. So, be deliberate when picking your confidence level and margin of error.
Having a 99% confidence level may sound attractive, but depending on your study you might be better-served saving resources for other aspects of your project by accepting a slightly lower confidence level, or slightly higher margin of error.
Rule 2: Not all surveys need statistically significant results
Depending on your target audience, it may not be possible to get enough responses to cross the threshold into having your results be “statistically significant”. Depending on the type of study you’re running, that may matter.
However, if it’s just for your own research and not something with a wider bearing, that may not be that big of a deal. It’s important to remember that any feedback you get is useful. If it’s from a smaller group you may want to show some restraint in how you apply the feedback, but it’s still valuable.
Rule 3: No matter the sample size, ask open-ended questions
You should always seek out text-based feedback. Though it can be harder to quantify, it’s incredibly valuable and something you should ask for in all of your surveys. The right open-ended question can add a lot of insights you may not otherwise get if you only ask close-ended questions.
Conclusion
Calculating the correct survey sample size can be tricky, but it’s an important step for ensuring successful surveys. Understanding your audience is an important aspect of running a successful business. Sending out customer surveys, like CSAT, or NPS are a great place to start but if you really want to get a strong pulse check, you need to have a sufficient sample size.
Moreover, keeping in mind general rules such as balancing cost and confidence level, understanding that not all surveys need statistically significant results, and including open-ended questions will help you get reliable and meaningful results. With a clear understanding of your target audience, you’ll be better poised to serve them and grow your business.