Rating Scale: Survey Questions and Examples

Last updated on February 22, 2025
Let’s delve into the intricate world of rating scales, unraveling their essence, utility, and the nuanced impact they have on the realm of customer surveys. Rating scales stand as a pivotal tool in gauging customer sentiments, offering a structured mechanism for respondents to articulate their feelings towards products, services, or various propositions.
This exploration is not just about understanding what rating scales are, but also about unlocking their potential through strategic application, evaluating their strengths and weaknesses, and recognizing their critical role in shaping customer experience strategies.
What is a Rating Scale?
A rating scale is a closed-end survey question that is used to evaluate how survey responders feel about a particular product or statement. This method is particularly enhanced by AI technologies which can analyze and interpret large volumes of data from these scales to provide deeper insights into customer satisfaction and behavior. Incorporating a customer experience strategy template helps in structuring this process, ensuring that the analysis of customer surveys is aligned with broader business objectives.
Responders are typically asked to choose from a range of options — which are scaled between two extremes— from Excellent to Terrible. The rating scale is a variant of the well-known multiple-choice question.
Rating scales are popular for their ability to allow quantitative measures to be applied to more abstract, subjective sentiments. Satisfaction, experience, perception, and feeling are all difficult to quantify, but when done well, a rating scale is useful for measuring performance or effectiveness and has application in personality research. The addition of AI in customer experience management can further leverage these quantitative measures, transforming them into actionable insights to improve overall customer satisfaction and engagement.

Types of Rating Scale
You can roughly divide rating scales into two categories: ordinal scale and interval scale.
Ordinal Scale
An ordinal scale is a variable measurement scale that presents the answers in an ordered manner. The scale is presented in the natural order, but the intervals between the scale are not fixed.
Example – Ordinal Scale
What is your experience level with computers?
- Advanced
- Intermediate
- Basic
- Novice
- Zero
It follows a clear hierarchy; however, the difference between advanced and intermediate, or novice and zero are not fixed measures.
The time it may take an individual to go from Intermediate to Advanced is unlikely to be equal to the time it would take an individual to go from Zero to Novice. Therefore, we can say these are not fixed or exact intervals.
Interval Scale
An interval scale has similarities to an ordinal scale. The question’s answers also follow an innate order, but they contain an equal and meaningful value between the intervals.
Example – Interval Scale
How satisfied were you with our service?
- Very satisfied
- Somewhat satisfied
- Neither satisfied nor dissatisfied
- Somewhat unsatisfied
- Very unsatisfied
Here, the difference between somewhat satisfied and very satisfied is mirrored by the intervals between somewhat unsatisfied and very unsatisfied. These intervals are equal, which differentiates it from the ordinal scale above.
Popular Types of Rating Scales
When conducting a survey, there are four types of rating scales that can be used effectively:
- Graphic rating scale
- Numerical rating scale
- Descriptive rating scale
- Comparative rating scale
Graphic Rating Scale
The Likert scale is a familiar example of a graphic rating scale.
Typically depicted in a table or matrix, the responder can select either a number (e.g., 1-3, 1-5) or a worded response (Very satisfied – Very unsatisfied) along the top of the matrix or table that corresponds to a list of items being asked.
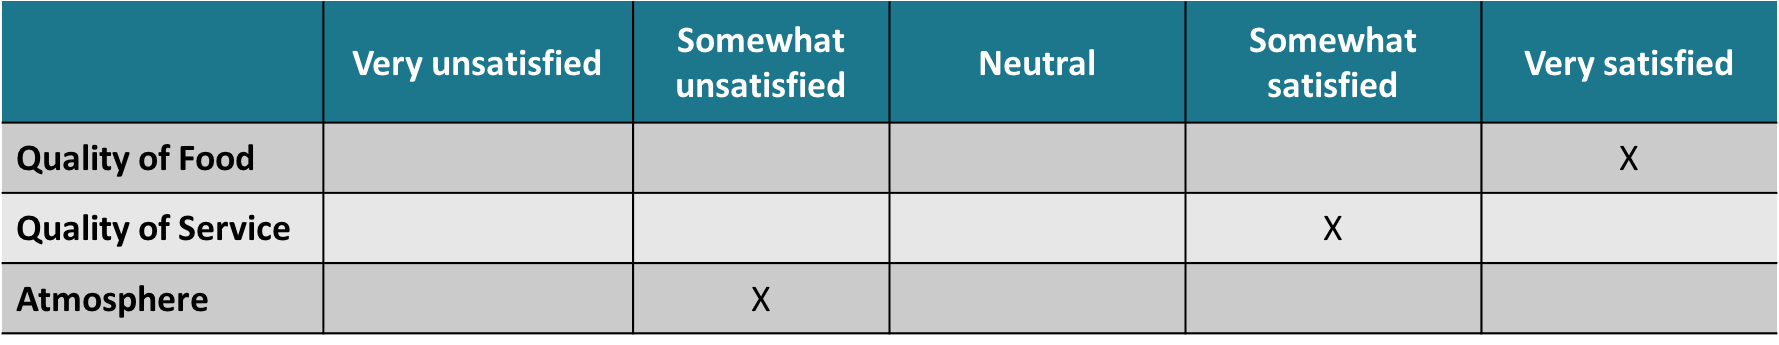
For example, in a question about a restaurant’s service, we see this grid where the item in question is represented on the left-hand side, meaning the responder can select their appropriate sentiment in the corresponding box.
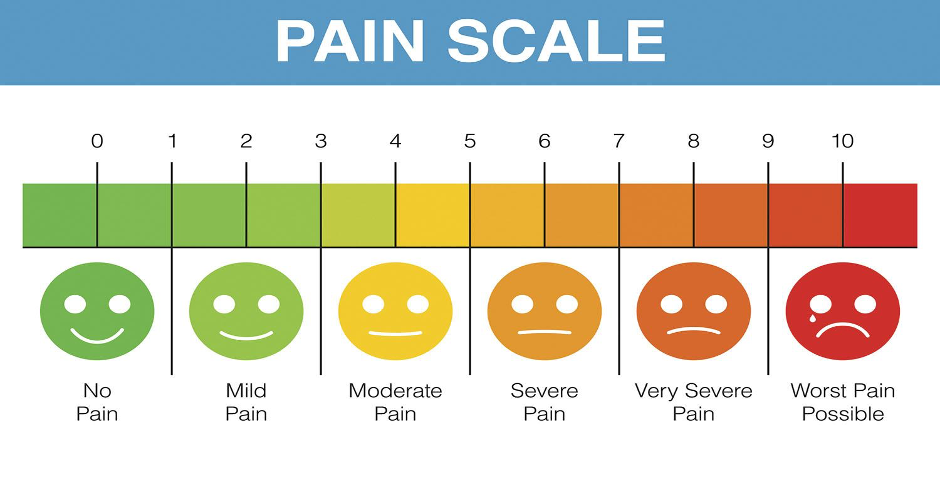
Numerical Rating Scale
A numerical rating scale uses numbers instead of words. This is one of the simplest and most common types of rating scale and will be familiar through its use as a numeric pain rating scale, which measures 0-10 — with 0 as no pain and 10 as the worst pain imaginable.
Descriptive Rating Scale
The descriptive rating scale does not require numbers, instead offering responders the choice of descriptive statements.
For example, the question “How happy were you with our service?” could be answered by either Unhappy, Neutral, or Happy.
Comparative Rating Scale
A comparative rating scale is used when a researcher employs a point of comparison, like McDonald’s, to compare with a different fast food restaurant like Burger King.
For example: Rate Burger King in comparison to McDonald’s.
- Excellent
- Very good
- Good
- Both are the same
- Poor
- Very poor
A comparative rating scale allows the researcher to interpret the resulting data in relation to another company or product.
How to Use Rating Scales When Measuring Customer Experience
Net Promoter Score
The Net Promoter Score (NPS) is often used as a representation of a customer’s loyalty for a business, product, or service. Also used to gauge their brand loyalty, this scale looks to find the net percentage of customers who are likely to promote or engage with a service.
Its key is in its simplicity, using just a single question that asks a customer:
“How likely, on a scale of 0-10, are you to recommend <insert company> to your friends, family, or co-workers?”
Customers are then assigned a category based on their score; a score of 0-6 are Detractors, 7-8 are Neutrals, with 9-10 being Promoters.
To calculate NPS, the percentage of Detractors is subtracted from the percentage of Promoters.
For example: If 70% of respondents scored your business between 9-10, and 10% scored between 0-6, that is 70 – 10, which equals an NPS of 60.
CSAT
The Customer Satisfaction Score (CSAT) is a straightforward piece of customer satisfaction methodology. It measures customers’ happiness with a service, product, or experience by using one direct question like:
“How happy were you with our service?”
This is then assigned a worst-to-best scale like 1-5 or 1-10.
You can get this functionality in-built within your customer support email software. The survey can be triggered automatically right after the query is resolved.
CES
The Customer Effort Score or CES is a single-item metric that is used to evaluate how much effort a customer expends when engaging with a company. This can be related to dispute resolution, purchasing or returning items, and requests or questions.
A CES question may use a scale of “very difficult” to “very easy,” giving researchers, for example, an idea of problem areas that need to be addressed.
5-star review
The 5-star rating will be familiar to most due to its ubiquity on Netflix, Amazon, iTunes, Uber, etc. Again, these are arranged with 1-star being the worst, and 5-star being the best.
One noted issue with the 5-star review is the tendency of users’ responses to cluster around either 1 or 5. These feast or famine distributions tend not to be a reliable representation of customer sentiment. So supplementing it with a comment box that allows open-ended feedback tends to produce more useful and representative data.
Likert Scale
The Likert scale is another type of survey scale. Frequently referred to as the satisfaction scale due to its suitability in measuring satisfaction, these scales ask a question like “how happy were you with our service?” and offer a scale from “very happy” to “very unhappy” with a scale of three, five or seven points used.
Getting the most out of rating scales
Each of these methods has its advantages and disadvantages. The simplicity of a scale can induce a higher volume of customer response, but some measure of attention must be paid to the quality of the feedback gathered. Simple closed-end questions can constitute a missed opportunity to really hear your customers.
Adding a comment box that allows customers to communicate their open-ended feedback is a great chance to find out what customers really think of you, in their own words, and not only within the artificial restrictions of the scale you have imposed on them. These insights have the power to tell you much more about what is or isn’t working for them, outside of statements that they are “very satisfied” or “very dissatisfied.”
However, many are often at a loss as to how to manage this uncategorizable data from a comment box. Numbers are neat and tidy and easy to scale up. Words are not. Everyone wants the insights, but not everyone is prepared to spend the days or weeks it would take to transcribe or outsource these comments. One particularly 21st-century solution is artificial intelligence.
Particularly, AI-powered text analytics software that is geared toward customer experience management. These text analytics can sift through this data, and pick out trends and critical points that require immediate attention, irrespective of the size of the survey. By incorporating customer experience analytics and conversational analytics, these systems not only identify trends and critical points but also enhance understanding of direct customer interactions, enabling real-time responses and improvements to the customer journey.
Summary
Rating scales are a quick and straightforward way to engage customers with surveys. They’re intuitive and easy to navigate if occasionally lacking in real depth. The trade-off in data richness can be countered with a simple piece of open-ended feedback, which unleashes a world of customer feedback analytics that can be used to power growth, change, and improvement.
If you want to read more about creating surveys, check-out: How to create better surveys: your business depends on it